

What is limiting nature investment?
The mandate is settled. The evidence is the problem.
EXPOSURE
Nature risk you cannot see
An institution cannot read its exposure to nature risk from the documents it currently holds.
IMPACT
Impact you cannot verify
What the money did on the ground is reported by the party receiving it.
COST
Answers that do not scale
Neither answer can be produced at a cost that works across a whole portfolio.

The bottleneck
Many regulations and standards to master. Massive, scattered datasets. Manual screening, per fund, every year. At the end of it you hold a document you cannot re-run, cannot compare to last year, and cannot defend line by line to an auditor.
Frameworks &
Regulations
Boundaries
Imagery
Context
Derived Datasets
Ground Audit
Each source arrives with a different refresh rate, accuracy and resolution, and each framework asks for it a different way. Reconciling them is where the weeks go - and it is the bottleneck to scaling beyond a handful of funds.
A whole portfolio in one click
We equip financial analysts and fund managers with auditable satellite analysis to disclose nature-related risk and avoid greenwashing.
Measure.
Monitor.
Report.

The platform: FINANCE2NATURE
MEASURE
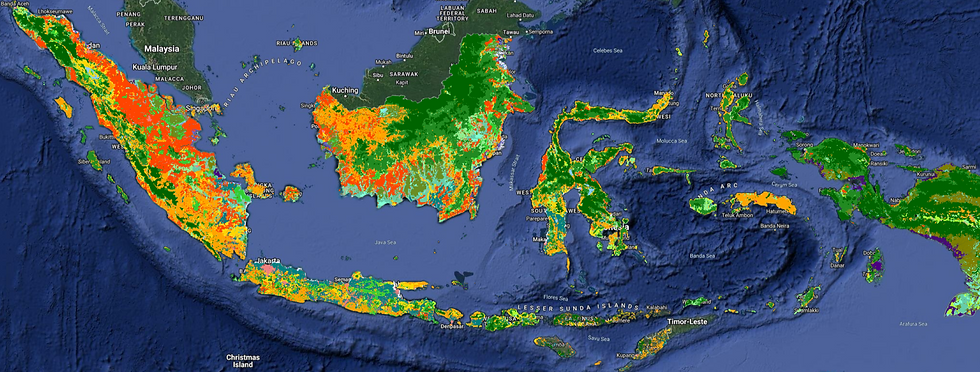
We measure what happens.
Satellite measurements at your portfolio locations, not a regional average, not a sector estimate. Per plot, per date - which is what makes it auditable.
MONITOR
Which assets are exposed, and by how much
Plot-level physical and climate risk, updated monthly, on the same coordinates you already hold.
DROUGHT
Water stress by plot
Multi-year trend
FIRES
Burn scars and alerts
Proximity to assets
FLOODS
Exposure by plot
Recovery after events
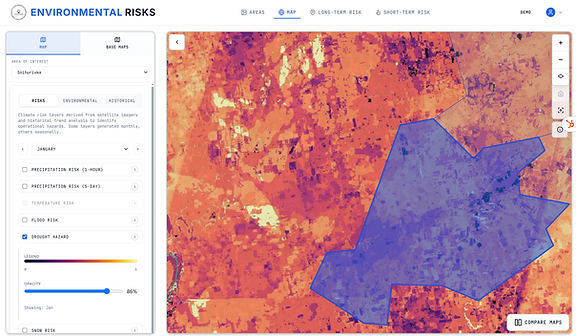
Plot-level exposure map, one score per asset.
MEASURE
Exposure to compliance risk
Seven commodities grown on land deforested after the cut-off date are banned from the EU market. Today, most institutions answer that question by citing a document written by the party they are lending to.
EUDR APPLIES FROM
30 December 2026
A plot reported as compliant and a plot measured as cleared are not the same plot. The difference is performance loss and reputation risk.
Reported — compliant

Measured — cleared

REPORT
The methodology is built once
You set the rules once. Every report after that follows them.
01 — REPORTING TEMPLATE
Choose the reporting framework
02 — METHODOLOGY
Write it down as a fixed methodology
03 — THE DATA
Open data where it is good enough, satellite where it is not

WHY IT HOLDS UP
The recipe is written down
The method is published inside the application, so your auditor can see how every number was produced — and so certification is possible.
Every report out in one click
One project or one portfolio in. The published method is applied and an editable draft comes out.
EUDR
TNFD
LP's quarterly report
PCAF
Investment
Screening
Pay per fund or per report. Secure integration on request.
“The platform helped streamline analyses that previously required substantial manual processing, allowing us to complete many tasks much more efficiently.”
Adrián Laín at SAIL Investments, &Green fund
Senior Sustainability Associate | ESG & GIS Specialist