
PORTFOLIO
Click on a marker to go to a project or simply scroll down
Space4Good has collaborated with partners all over the world to work on challenging and impactful projects. Explore a selection of our projects below.


Agriculture & Forestry


Conservation & Biodiversity


Peace &
Justice


Climate & Infrastructure
50+
PROJECTS
1+
PB DATA PROCESSED
63
COUNTRIES
Biomass Estimations
Remote sensing-based biomass estimation using artificial intelligence
Summary
Biomass estimations using remote sensing provide unlimited opportunities, such as carbon sequestration monitoring, carbon credit conversion, yield and resource predictions, and risk assessments. To date, Space4Good has worked on biomass estimations in Southeast Asia, Africa and South America. But how do we do it? Using two distinct approaches for biomass estimation in three different ecoregions, we were able to determine biomass estimations for the selected agroforestry and mixed-tropical forests to a high level of accuracy.
Methodology
The first approach utilizes high and low-resolution data from drones and satellites on which we apply an object detection algorithm to identify individual trees. Based on these trees and the various size clusters determined by the algorithm, biomass for the entire plot can be calculated. Due to high biodiversity in these areas, comprising multiple tree species, age and structure, we added a second approach for improved results.
The second approach uses a generic biomass algorithm, which requires specific tree data inputs coupled with a deep-dive investigation of species metrics. Accordingly, we are able to apply the algorithm to ascertain an above-ground biomass estimation taking into consideration all these metrics. The final estimate uses a weighted average of the biomass depending on the area covered by each species.
Using artificial intelligence, these methodological outputs will enhance over time as more reference and training data are input to better train our machine learning algorithm.
Partners
All projects are different, and as the value of ecosystem services become more notable, the need to monitor and manage them well is more important. Space4Good takes into consideration the unique contexts that projects are applied to. Interested to learn how we could contribute to your biomass estimations? Reach out
First approach
Second approach
Illegal logging detection and prediction
Environmental Crime detection and prediction for mixed tropical systems
Summary
Deforestation will release as much CO2 in the atmosphere in 24 hours, as 8 million people flying from London to New York. It is estimated that in 100 years, there will be no rainforests left if deforestation continues at the present rate. The key to combating these pressing problems is detecting and predicting illegal deforestation practices to ensure a swift and effective response.
To combat deforestation and forest degradation in tropical rainforests, Space4Good, in collaboration with Indonesia-based Arsari Enviro Industri, aims to deliver a reliable and near-real-time monitoring platform that can detect deforestation events at a high spatial resolution. In the context of mixed tropical agroforestry ecosystems, the approach we are developing is both novel and innovative.
Methodology
Using the time-series data from the ESA Sentinel-1 radar satellite in combination with the local expertise (knowledge and feedback loop from local experts) and Artificial Intelligence, we can accurately map the deforested areas and alert the local authorities. But how does it work and what is new about the platform? The improved timeliness, scale, and resolution of the information derived from Sentinel-1 data have made it possible for the local stakeholders to monitor thousands of hectares remotely. There’s even more to it. The conventional cloud and haze cover problems associated with the tropical areas are eliminated with the inclusion of Sentinel-1 radar data that can see through the clouds and surpass these challenges and record and characterize the magnitude of change. Through the approach, it is possible to assess both the extent as well as the time of the deforestation event.
We are now able to remotely monitor deforestation and alert local authorities via social media to the occurrence of an event. We can even go so far as to ascertain risk areas and predict deforestation events by taking into consideration pattern recognition using AI, land-use change, and a multitude of other factors to determine drivers and key areas where deforestation is predicted. Knowing when and where deforestation occurs can help reduce these catastrophic emissions by preventing the loss of the earth’s essential forest systems and enable a quick response to illegal deforestation.
Partners

Detected deforestation in 2019 and 2020. (Switch layers on and off using the toggle and get more information by clicking on the polygons).
573
DEFORESTATION DETECTIONS
Since 2019 - in the 200,000 hectares of mixed tropical
Aforestation Monitoring
Remote sensing-based ecosystem monitoring insights for restorative practices by project developers
Summary
Space4Good is working with Hommes Et Terre to facilitate their development and implementation of agroforestry, and ecosystem restoration projects. Their work is aimed at ensuring communities have sustainable access to fertile land. In early 2022, Hommes Et Terre requested a solution to assess tree growth and detect differences over time at a collection of sites in Burkina Faso, Africa to gain more targeted and efficient planning as well as improved policy-making.
Methodology
Space4Good conducted an assessment assessing vegetation indices using satellite imagery which reveals the state of the vegetation health. From there, Space4Good developed a methodology leveraging GIS and GEOSS techniques using sample sets of plots and the most appropriate vegetation indices and statistics to complement the existing monitoring methods of Hommes Et Terre. For each plot, we classified the fields using a pixel-based approach. With the help of Space4Good's expertise, the model will be further refined to generate better estimations of the restoration quality, above-ground biomass growth and vegetation coverage. The satellite-based vegetation indices and their statistics can help in identifying the best-performing areas when mapping afforestation efforts and the actual and potential limitations during the process can be identified.
Partner
Performance withing 1 site (pixel-based 10 by 10 m resolution)

Fire detection and risk assessments
Near real-time feedback on fires in mixed tropical systems
Summary
Space4Good builds on fire detection insights offered by NASA and Global Forest Watch by offering algorithmic analyses of Sentinel datasets overlaid with existing datasets. These insights are then fed through pipelines directly to local field workers to better mitigate the destruction of fire activities in mixed tropical forests in good time.
Methodology
Our server will check relevant alert ecosystems hourly. As soon as we get a fire or deforestation alert that is inside the monitored area or close by, an alert is generated and disseminated to in-field operatives via a navigation application on the phone. This is also able to be used offline to ensure nothing is missed. Additionally, messages are pinged to WhatsApp groups to alert fieldworkers. It is here that the real work begins! Field operatives then navigate their way to the identified locations and validate if the event occurred (or not). Our partner will then inspect the area and send us their feedback with the location of the event, the description of the occurrence, and photos taken by phone (and in some cases, drone to ascertain a better understanding of the extent of the incident). These incident validation reports then provide a more complete overview of the kinds of activities and extent of the damage.
Monitoring the area and having these insights is only one piece of the story. It is in partner relationships that necessary ground-truthing for accurate algorithm development can be made, implementation and mitigation procedures can be carried out and ultimately, the real impact can be ensured.
Partner
Fires detected
Fire alerts detected in 2020. (Click on a markers for more information).
112
FIRES DETECTED
Since 2020 - in the 200,000 hectares of mixed tropical
Pest and disease monitoring for horticulture
Pest and disease early warning and prediction platform
Summary
Farmers all over the world are having trouble in their daily decision-making when it comes to the health of their crops. Inefficient horticultural practices coupled with aggressive plagues and diseases can cause a decrease in the yield of up to 40%. Each day that action is not taken, the yield can decrease a further 1-3% with larger effects on profits amounting to a decrease of 3-5%.
Space4Good has in cooperation with Fauna Smart Technologies founded Space4Fauna for the PARSEC Accelerator program to help farmers effectively combat plagues and diseases in good time and thus increase their yield and profit.
Methodology
Space4Fauna is a mobile application that is capable of predicting and detecting plagues and diseases. The moisture, greenness, humidity, and temperature of crops are monitored using satellite imagery and are used to determine and map the risk of a plague or disease outbreaks. Farmers can monitor the state of their crops and as a result, take action accordingly.
The field is divided into healthy crops, mild pest attack and high level of pest attack. This information is connected to the Knowledge DataBase, which determines the best environment-friendly and economically viable solutions to handle an outbreak. Starting in Serbia with progressive apple and pear growers, Fauna Smart Technologies and Space4Good are now developing both the platform and algorithms to be scaled across other regions and horticulture applications
Partners
Effects of pest and diseases
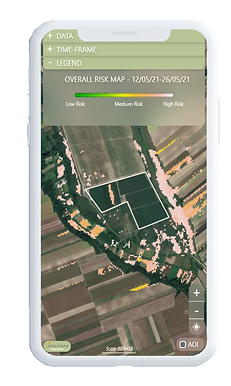
Mobile application displaying the risk maps.
Pest and disease risk mapping in timber
Analyses and risk assessments of bark beetle activity from space
Summary
Space4Good has been monitoring forests in Switzerland to assess bark beetle risks. Bark beetles often target weakened trees by, as the name suggests, breeding between the bark and the wood of the tree. In some cases, even healthy trees suffer from bark beetles, due to the sheer amount of bark beetles overwhelming the tree's defences. Outbreaks seriously impact the timber industry, water quality, fish and wildlife and property values. And as climate change increases stress to ecosystem products, we see longer hotter summers and warmer winters leading to overwhelmingly successful breeding cycles of these little critters.
Methodology
Space4Good uses two risk models that classify the timber plantations in 7 risk levels; 1 being very low risk and 7 being high risk. Both models use a combination of Sentinel-2 imagery, soil information, weather data and forest conditions to best determine where these beetles are likely to emerge.
-
The first model, which was conducted during the season, takes all parameters into account, emphasising soil characteristics. The model resulted in a classification where the largest area is classified as risk level 1 and the largest number of outbreaks are classified in risk level 7, as one would expect.
-
The second model focused more on parameters as described in scientific literature. The results are less clustered than the first model, but get pixelated and require aggregation based on pixels with the same value. This makes it easier to see high-risk level areas and visit them in good time to best control an outbreak.
As expected, models will continue to improve to better detect overlooked outbreaks by adding Sentinel-1 imagery and shifting to a more intensive data-based approach.
Partner
To learn more about Space4Good’s work on this matter, read our blog post.

Bark beetles breed between bark and wood
Beetles affect lumber industry, water quality, wildlife and property value
NO2 monitoring for socio-economic recovery assessment
Monitoring economic COVID-19 response and recovery from space
Summary
With the outbreak of COVID-19, Space4Good investigated how it can utilise satellite earth observation to assist our governments in rapid response and recovery. We decided to monitor air pollution and in particular nitrogen dioxide (NO2), as a proxy for socio-economic developments which sparked the interest of the World Bank Group, In a joint effort, we developed a nitrogen dioxide (NO2) monitoring platform which provides economists and decision-makers an alternative big data source to observe changes in socio-economic activities as a result of the COVID-19 pandemic.
Methodology
NO2 emissions are generally caused by anthropogenic activities, such as fossil fuel combustion, which makes it a great indicator of industrial activity and motorized mobility. To measure air quality, NO2 used to be measured using ground stations. Nowadays, satellites are a better alternative to this, as it allows for measuring on a larger scale and is independent of geographical obstacles. A new satellite mission, Sentinel-5P, is capable of detecting tropospheric NO2 using the TROPOMI instrument. The Sentinel-5P resolution has a higher spatial resolution when compared to other satellite missions with the same purpose. This high resolution enables analysis on a regional, national and sub-national scale. We started our collaboration on single provinces in Indonesia which led to promising results, therefore scaling our work to the whole of Indonesia, Vietnam and selected MENA cities.A local analysis explored the NO2 patterns and behaviours across different areas in Indonesia and Vietnam before and during the COVID-19 crisis. Although the pandemic is a shared event, these areas show individual fingerprints and unique behaviours to this global situation.
The next steps for the Big Data NO2 Observatory include advancing the platform with new features, validation methods, and expanding to other regions. Space4Good looks forward to the impacts these insights will provide to the World Bank and local communities affected by the pandemic.
NO2 Sentinel-5P maps pre and post Covid-19 lockdown
Partner

Did we spark your interest?
Get a demonstration of our portal by contacting us.
UXO detection and post-conflict assessments
Using satellite imagery to verify, assess and monitor the consequences of military conflict
Summary
In 2020, Space4Good met with the Carter Center at the Data for Peace & Security Conference in The Hague. We connected over remote sensing and geospatial analysis to monitor and support conflict resolution in war-torn regions. It was then that we saw the major potential and solutions in how to support assessing the consequences of military conflict by providing remote sensing-based insights and increasing transparency. Carter Center agreed and we started our project focused on various districts in Syria.
Methodology
Using change detection analyses to assess damage to buildings and neighbourhoods as a proxy for remaining explosive weapons, Space4Good offered optical change detection and multi-spectral change mapping using Sentinel 1 and Sentinel-2 data in conjunction with optical artificial intelligence algorithms to identify buildings. Then, combined with filtering out seasonal fluctuations and noise, we were able to detect small-scale changes during and after bombardment events. Further combining these with land use classification mapping, more accurate results could be obtained.
The project enabled a better understanding of the consequences of conflict, urban damage, and growth for good with the added benefit of protecting lives on the ground and supporting peacebuilding activities. In combination with previous work on UXO prediction with the HALO Trust in Libya, the Space4Good team is building out its competence on Peace & Justice innovations and is looking for testing and implementation partners.
Partners

Methodology flowchart
Flood extent mapping
Near-real time flood extent mapping
Summary
On 12th Jan 2021, World Bank requested a quick high-resolution flood assessment in Morocco, mainly around the Casablanca area (33 deg 32’N, 7 deg 35’W) and the surroundings. This result could serve as a second reference to the Global Precipitation Measurement (GPM) data that was being used by several World Bank clients and insurers.
Methodology
Based on European Centre for Medium-Range Weather Forecasts ECMWF data, the approximate dates of flooding were first determined. Since the maximum rainfall was observed on January 3rd, 2021 we assumed that the flooding had happened on 3rd Jan 2021 or the day after.
We selected 2 before (31st Dec 2020) and after (5th Jan 2021) Sentinel-1 images for the flood extent mapping and used a thresholding method on the Sentinel difference image (after-before). The methodology was further refined by masking the flood pixels from areas of permanent water bodies (i.e. where there is water >10 months of the year) and the areas with >5% slope using a digital elevation model (DEM). The flood area was estimated to be approximately 1550 ha (when a 1.5 threshold was applied) and 3501 ha (when a 1.25 threshold was applied).
To validate which of the 2 maps was more accurate, we referred to the news articles and got real-time information from the residents of Casablanca (who reported the street names that were flooded). Select streets names (and their coordinates) that were flooded are mentioned below:
1) Zerktouni (33.580389, -7.632144)
2) Bachkou (33.564108, -7.627390)
3) Lissasfa (33.532449, -7.672436)
4) I'Hermitage (33.566951, -7.620600)
5) Rue Hafid Ibrahim (33.587810, -7.628725)
Partner
Flooding map

If you are working on flood risk assessments and want to explore novel, earth-observation supported applications please reach out to our natural disaster team.
Monitoring changes in groundwater storage
Quickscan on groudwater level changes in Pakistan
Summary
In early 2021, Space4Good received a request from the UN International Organization of Migration to perform a quick scan on how the groundwater levels have changed over a course of time in Pakistan. An Increasing amount of groundwater abstraction has caused a significant decline in the groundwater levels in Pakistan, thereby increasing the irrigation costs, causing ecological imbalance and affecting the livelihood of the large population dependent on groundwater-based irrigated agriculture. The use of groundwater resources for irrigation has increased significantly from 8% in 1960 to more than 50% in 2010, demanding necessary actions towards the monitoring and sustainable use of groundwater.
Methodology
In this context, the team at Space4Good performed a short-term and long-term analysis to understand the variability in the groundwater. In order to get a short-term picture of the status of the average groundwater distribution at the national scale, we developed a time-averaged map of groundwater storage over a period of 1 July 2020-30 September 2020. The data from Gravity Recovery and Climate Experiment (GRACE) and GRACE-FO (Follow on) were used to estimate the groundwater storage (mm) at the resolution of 0.25 degrees (~28 km). The analysis revealed the groundwater deficit areas in the country (particularly in the southeast region), thus showing that the withdrawals in these areas have exceeded recharge.
Furthermore, a long-term analysis of groundwater changes was also performed in the Indus basin using equivalent water thickness (EWT) derived from GRACE and GRACE-FO over the period of 2010-2020. Overall, EWT showed a decreasing trend from Feb 2010 to Aug 2020, with the lowest value in 2019 (-22 cm).
Partner
Groundwater storage map
.png)
.png)
Latrine Infrastructure Monitoring for Fund Verification
Using Deep learning-based models and high-resolution aerial acquisitions to detect and count sanitation structures in selected areas of interest.
Summary
Amref Health Africa is working with governments, communities, businesses, and financial institutions to create a sustainable sanitation market in Kenya, Uganda, Tanzania and Ethiopia. To do so, Amref requested a solution that uses GIS and GEOSS techniques to detect and count sanitation structures in selected areas of interest in Uganda, Africa.
Methodology
To find the most suitable pipeline, Space4Good developed and tested various deep learning-based methodologies resulting in an extensive mapping of latrines using UAV high-resolution imagery. Two main approaches were tested: 1. building segmentation and 2. object detection. Using the labels created manually, the chosen model reached a precision of 87% and a recall of 79%. The predicted points were then vectorized and the heat map was created. Considering that it can be very hard to distinguish some of the latrines due to the lack of distinguishing features, their size or even tree cover for the human eye, these results are upstanding. The final results can be filtered according to the level of confidence desired.
This proof of concept for Uganda exemplified the feasibility of the applied remote sensing methodology developed by Space4Good. It will lead to more efficient, applicable, and targeted planning and intervention processes in the sanitation market. To expand the partnership into further areas, Space4Good advises expanding analyses and allocating more resources for the data retrieval (as well as to iteratively improve the methodology even further) to better locate latrines, retrieve distribution information and facilitate programs in areas with sub-optimal sanitation infrastructures.
Some of the latrines detected and heatmap.
Partner
Rooftop potential analysis
Developing a Roof Potential Map for Rotterdam
Summary
With the Netherlands being one of the most densely populated countries in the world, efficient use of space is crucial in urban planning. Space4Good has collaborated with zoarchitecten and the Municipality of Rotterdam to map existing and potential uses of roofs in the city centre of Rotterdam. This resulted in a Roof Potential Map that urban planners and architects can use to find opportunities for practical and environmentally friendly solutions. The final product consists of a map that visualises the existing uses of the roofs, classified into 16 categories, including blue or green infrastructures and solar energy potential.
Methodology
How do we do this? Together with the University of Leiden, we developed an algorithm that uses machine learning and deep learning methods to automatically detect existing roof types for potential clients, generating usable maps for planners and decision-makers alike.
The potential of city planning enabled by remote sensing propels decision-makers into new realms of possibilities. In being able to better map potentials, identify risk and determine efficient and impactful decisions, the mission to build greener cities for a better world is more possible than ever before.
Rooftops classification Map
Curious as to what else remote sensing can tell us about cities and make them more sustainable and resilient? Contact us to explore.
Partner